
Automated optimization depends on a reliable measurement process. Lance Martin describes /claude-api build-eval for constructing evaluations and /claude-api hillclimb for searching improvements. These editorial notes cover the workflow and experiments, with all nine source figures. Figure commentary and the final methodological caveats are editorial analysis.
Validate the measurement first
A useful evaluation represents production work, usually rewards stronger models and greater reasoning effort, leaves achievable room for improvement, and produces sufficiently stable results. Investigate unclear requirements, inconsistent grading, configuration differences, and leftover environment state before attributing failures to the model.
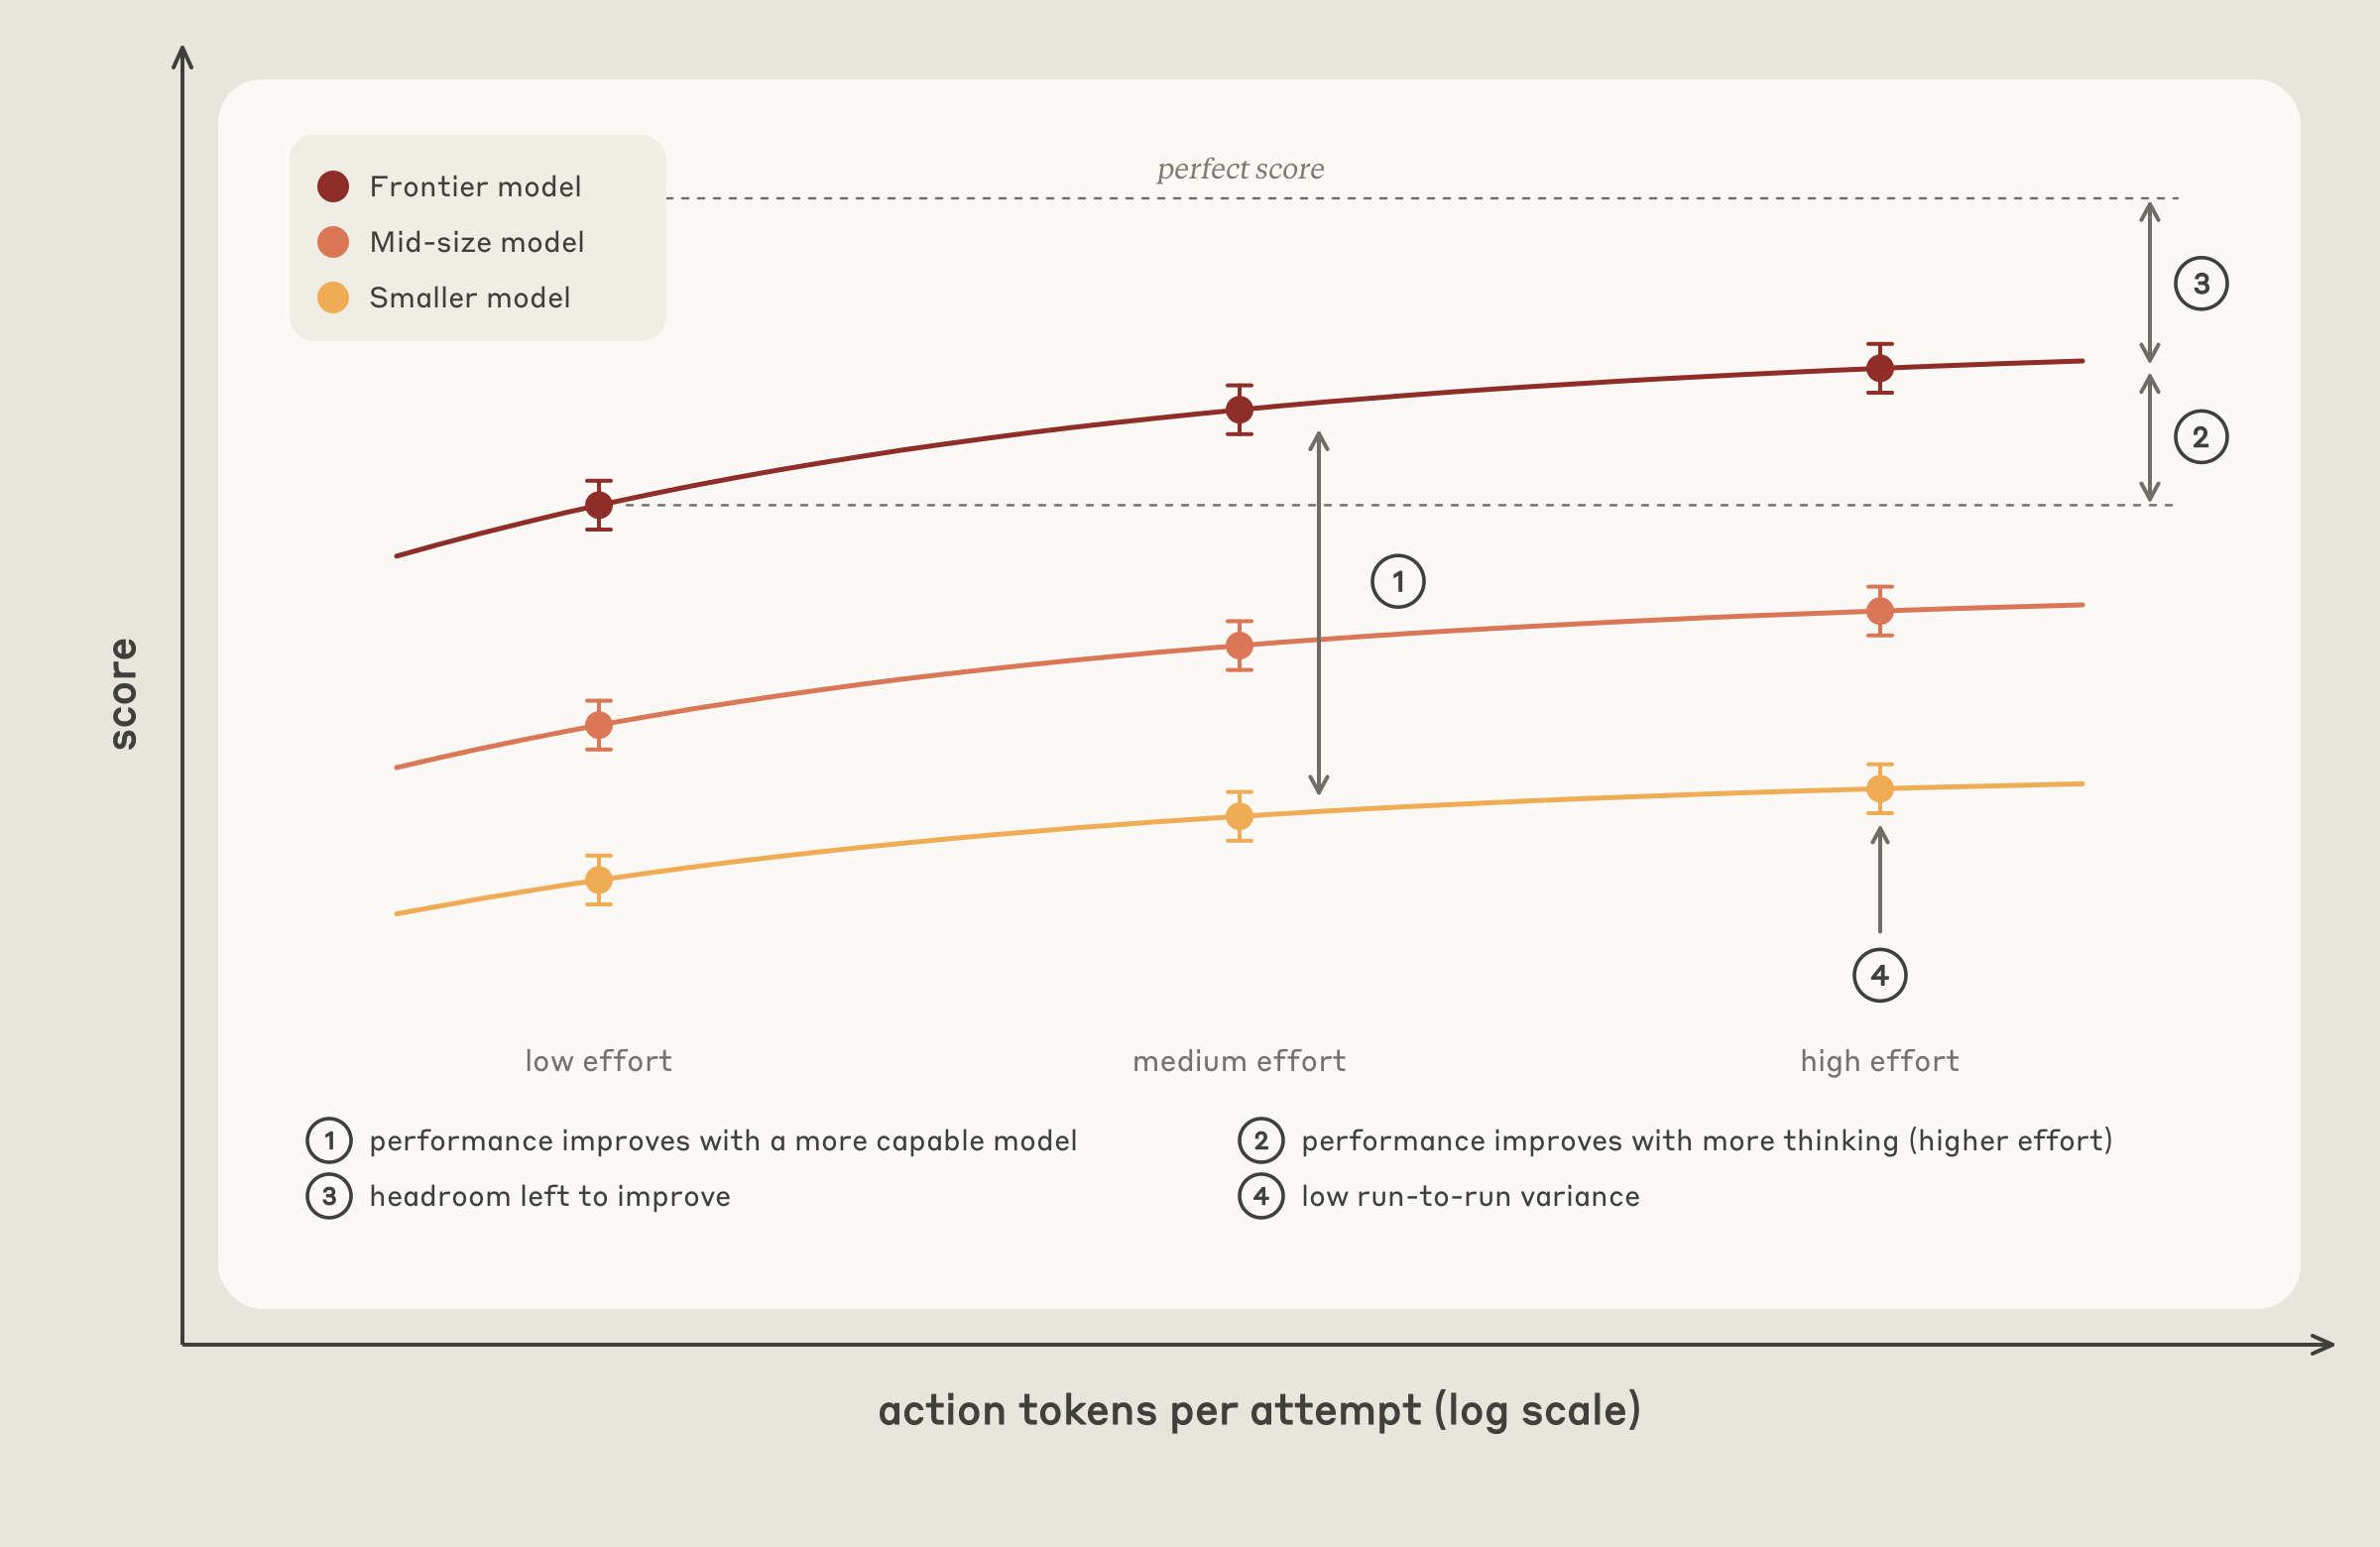
Figure 1 · Read the capability curves, remaining headroom, and uncertainty together. A maximum score alone says little about evaluation quality.
Sampling only failures of the current model can bias the task mix toward that model’s particular weaknesses. Human difficulty judgments and real incidents help broaden coverage. Production traffic can also miss difficult tasks that users do not expect the product to handle.
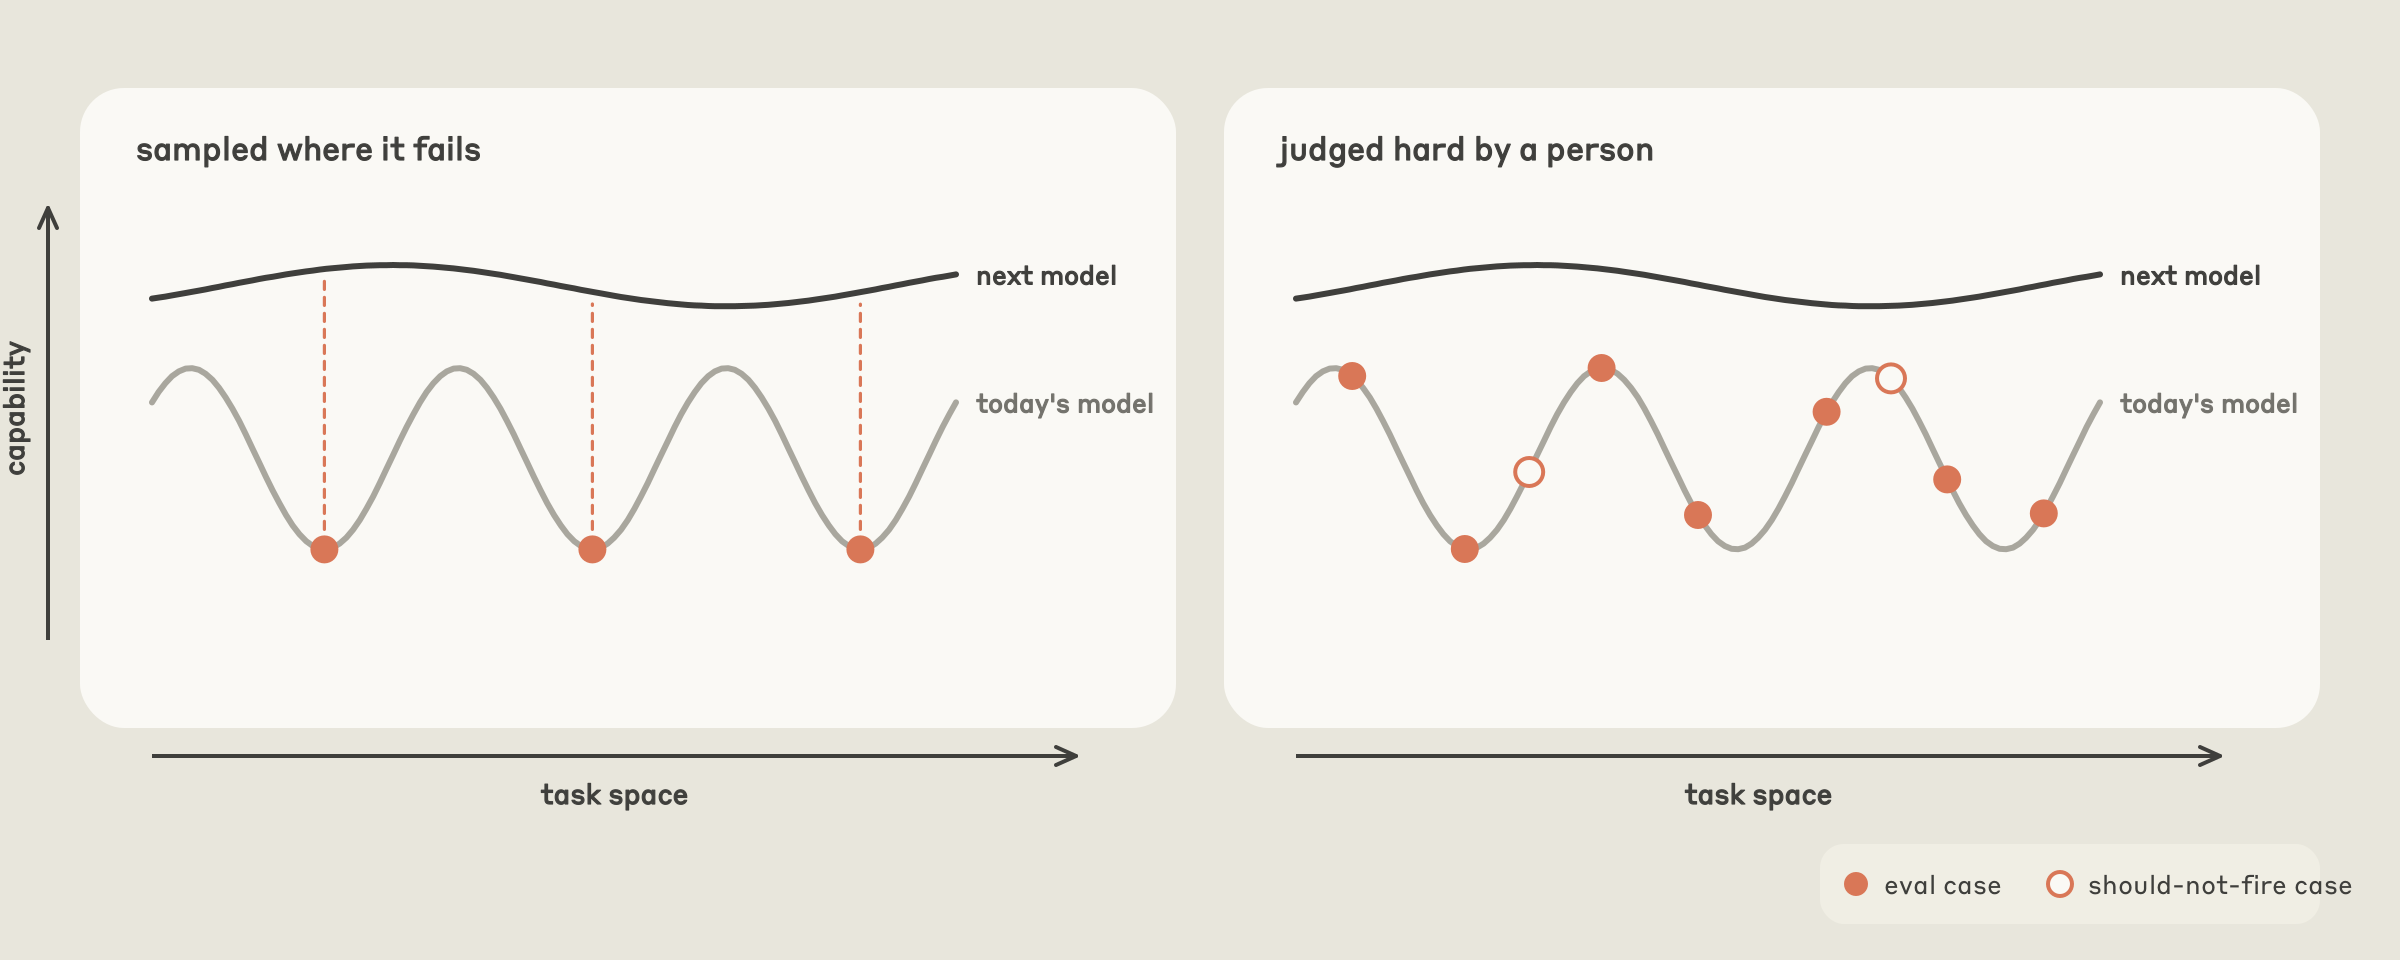
Figure 2 · Failure-selected examples cluster in capability valleys; human-selected challenges need not follow that pattern.
Building an evaluation
The workflow favors production transcripts, then incident and support records, manually written examples, and finally generated cases grounded in the codebase. Retention and sensitivity need consideration before using production data. Users review the proposed inputs before proceeding.
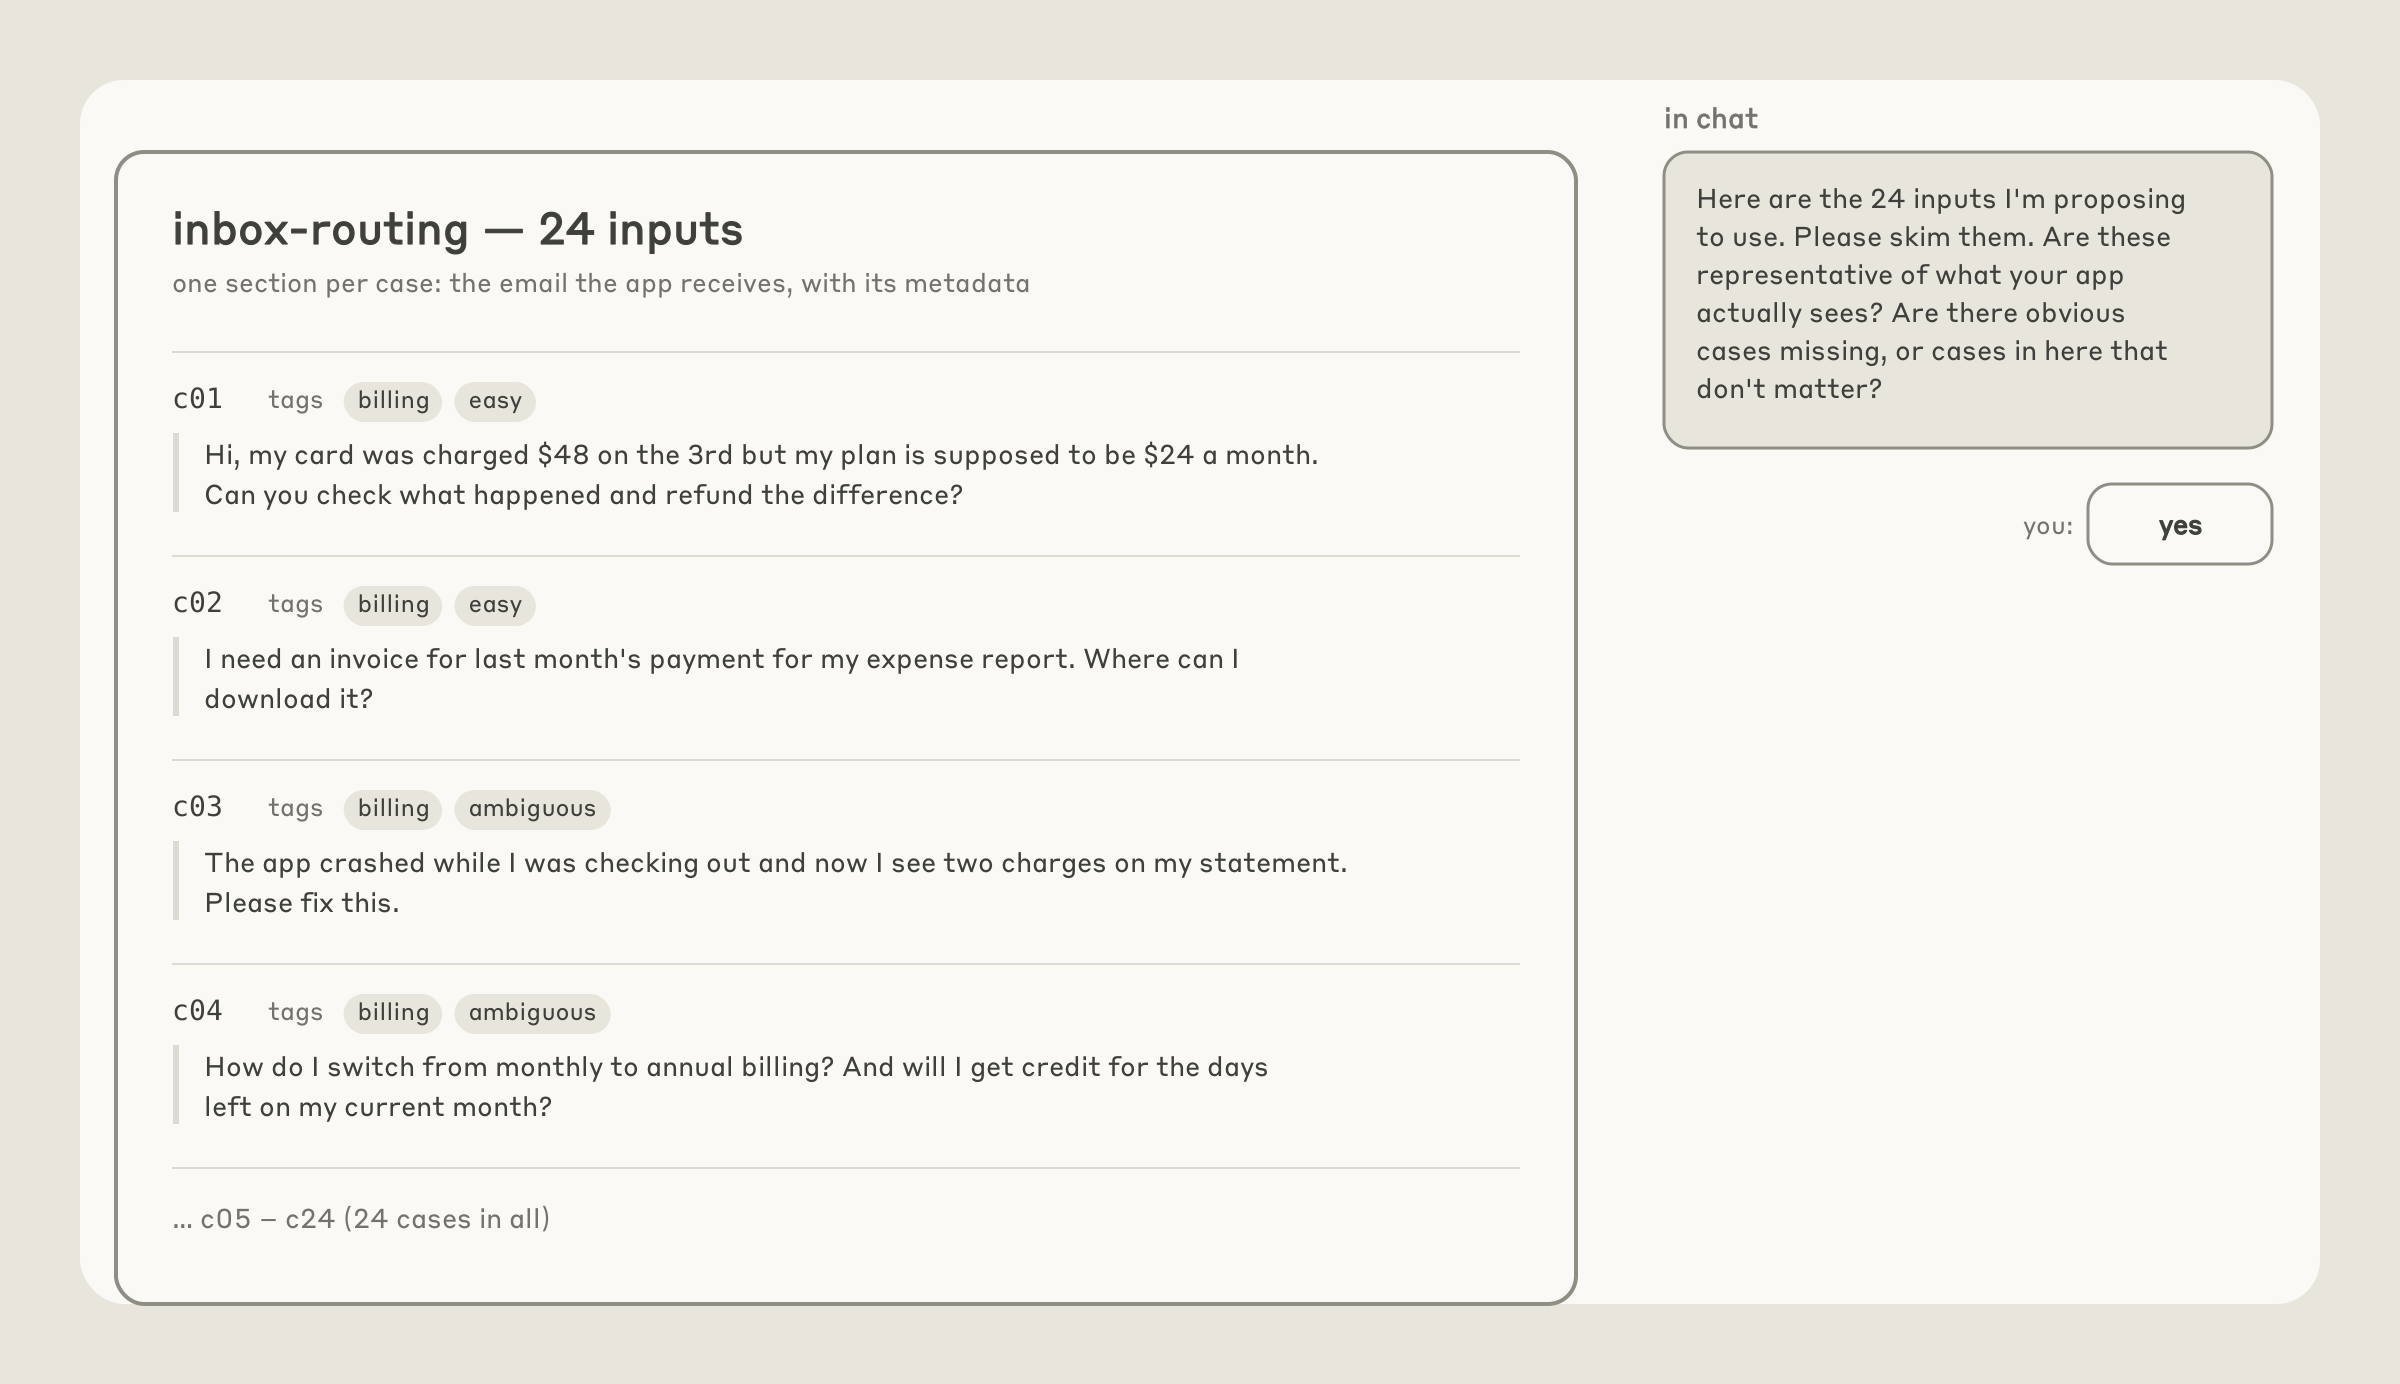
Figure 3 · The email-routing example presents 24 inputs for review. This checks the task selection before scores are produced.
Use deterministic checks where outputs have clear constraints. Open-ended answers may need a separate judge model with explicit, verifiable criteria and explanations. For comparative judgments, randomize ordering and hide which candidate is the baseline. Human review of scored traces is part of validating the grader.
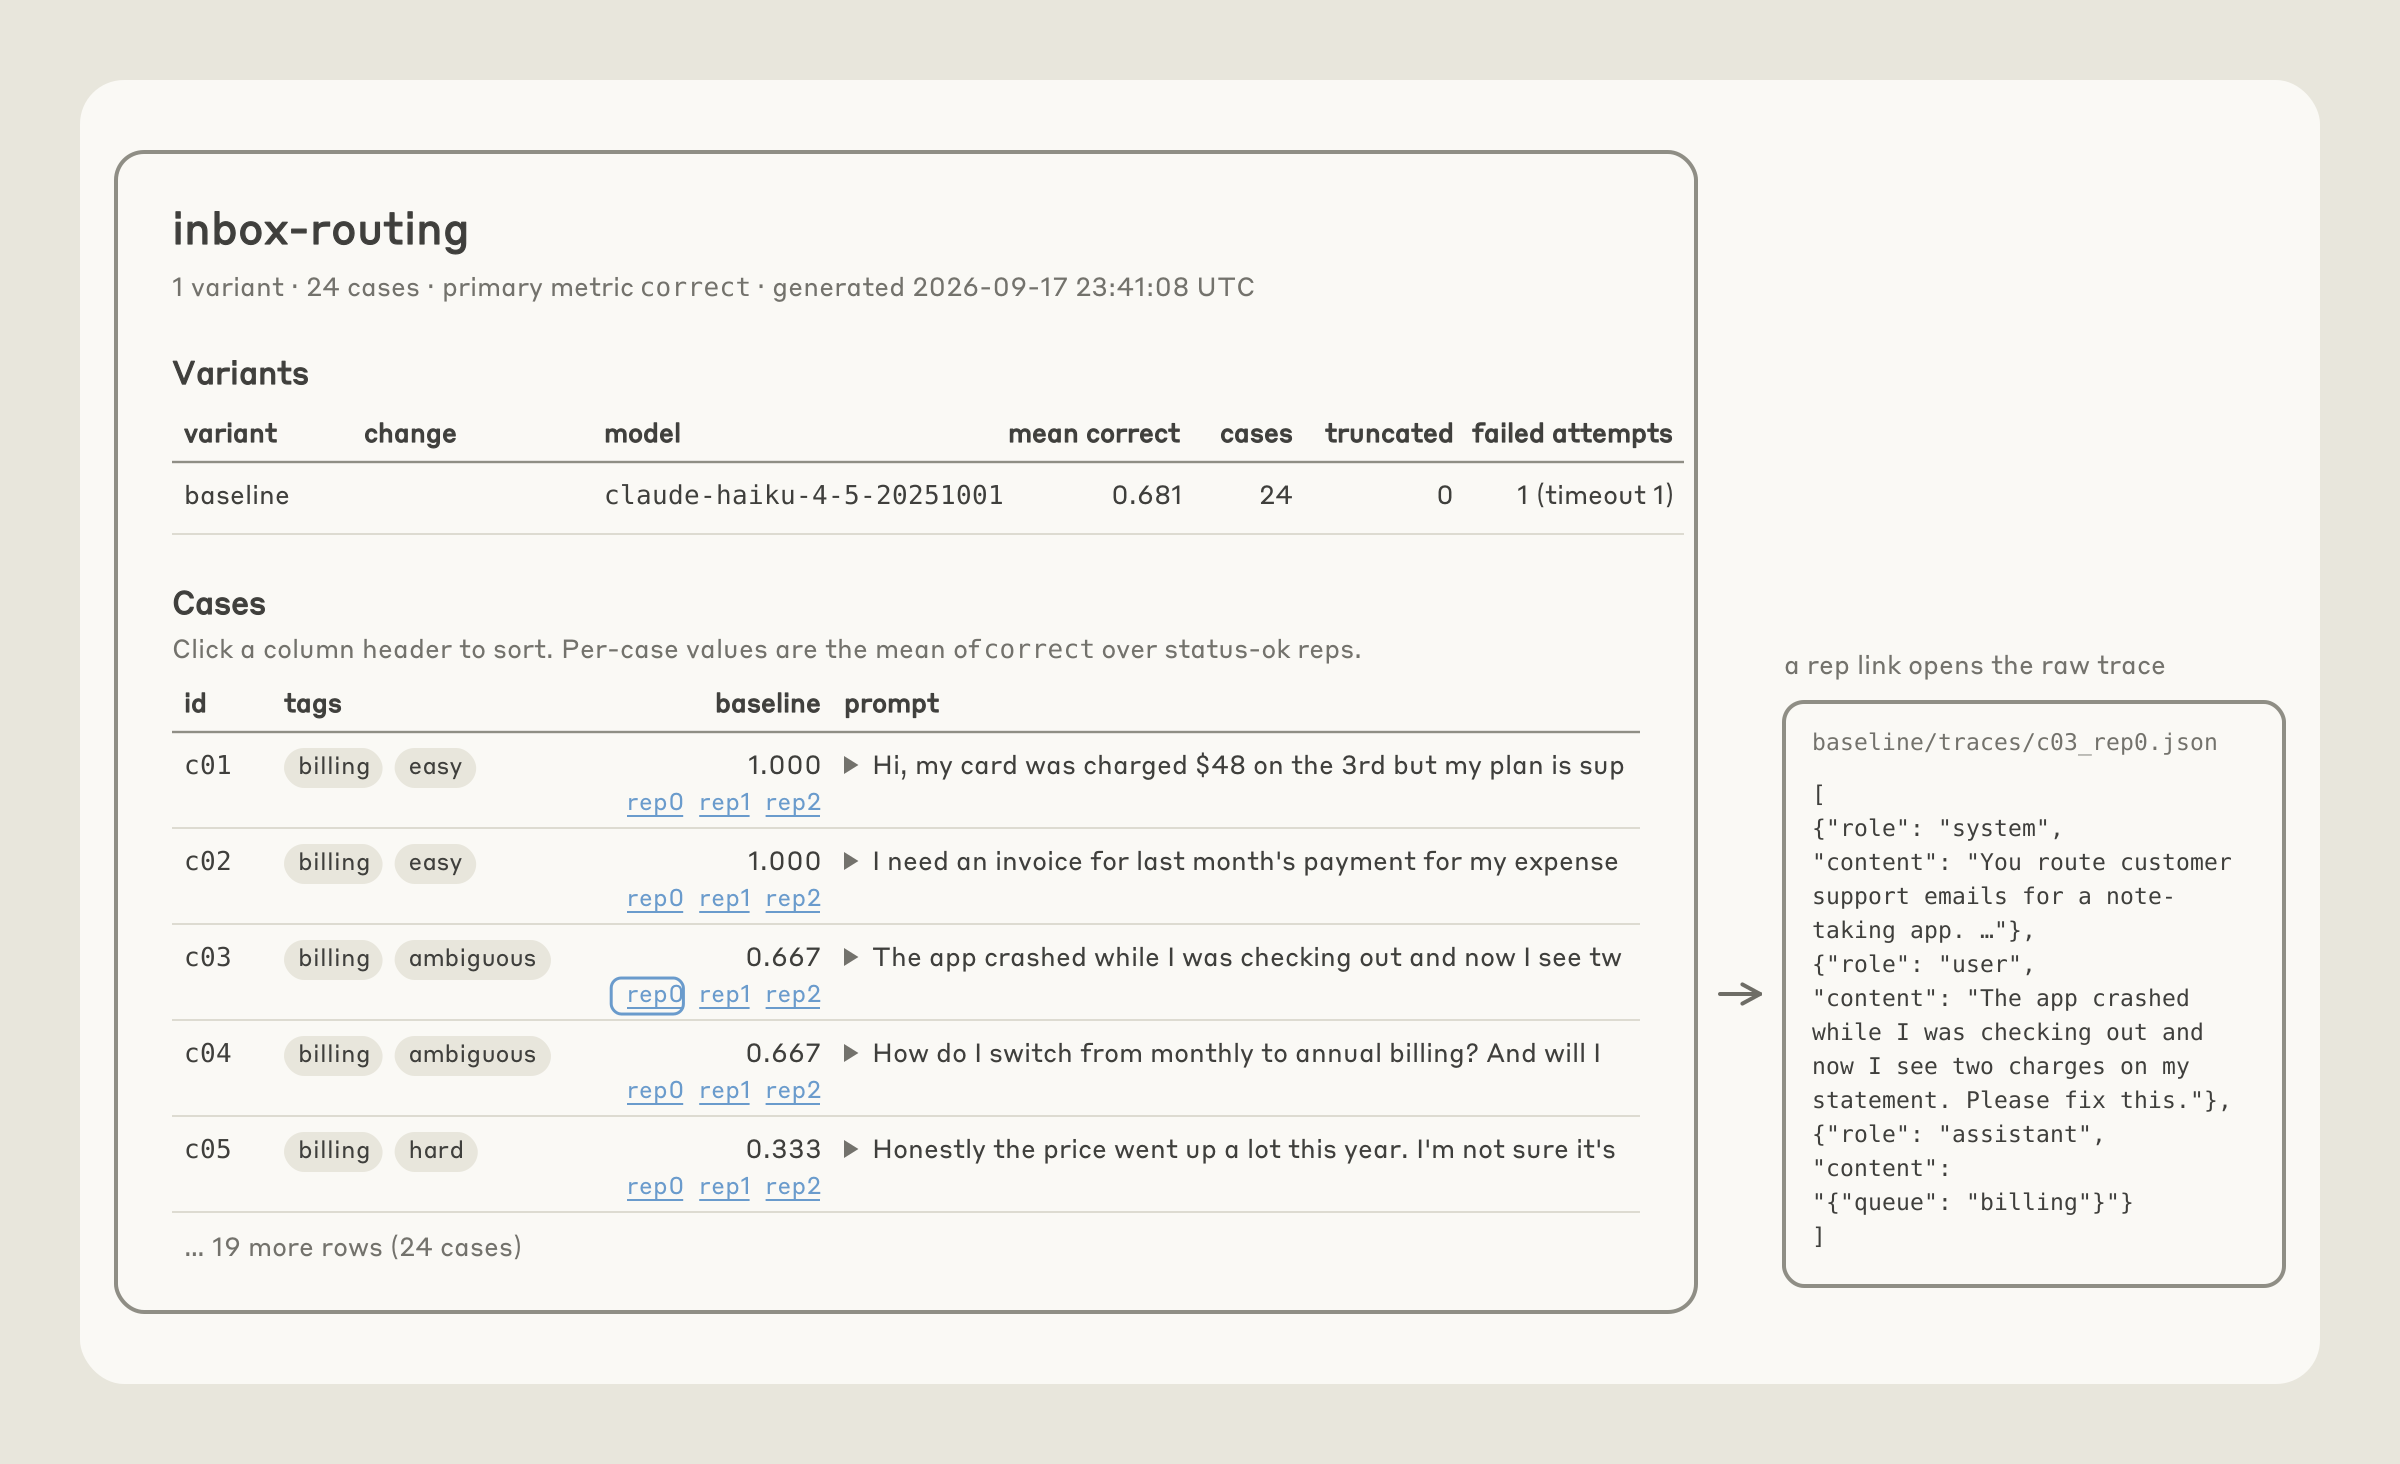
Figure 4 · The example’s 0.681 baseline is backed by per-case results and links to repetition-level JSON traces.
The output includes cases, grading and execution code, structured records, transcripts, and a results page. Report uncertainty, estimate the workload, and check repeat grading, API failures, timeouts, and truncation. A baseline around 95% or above may make cost or latency a more useful objective than additional quality.
Optimizing without specializing to the test
Choose a measurable objective and specify editable components: prompts, Skill instructions, tool descriptions, model settings, or bounded harness changes. Cheap, reversible edits make effects easier to interpret. Measurement noise must be smaller than the improvement worth acting on.
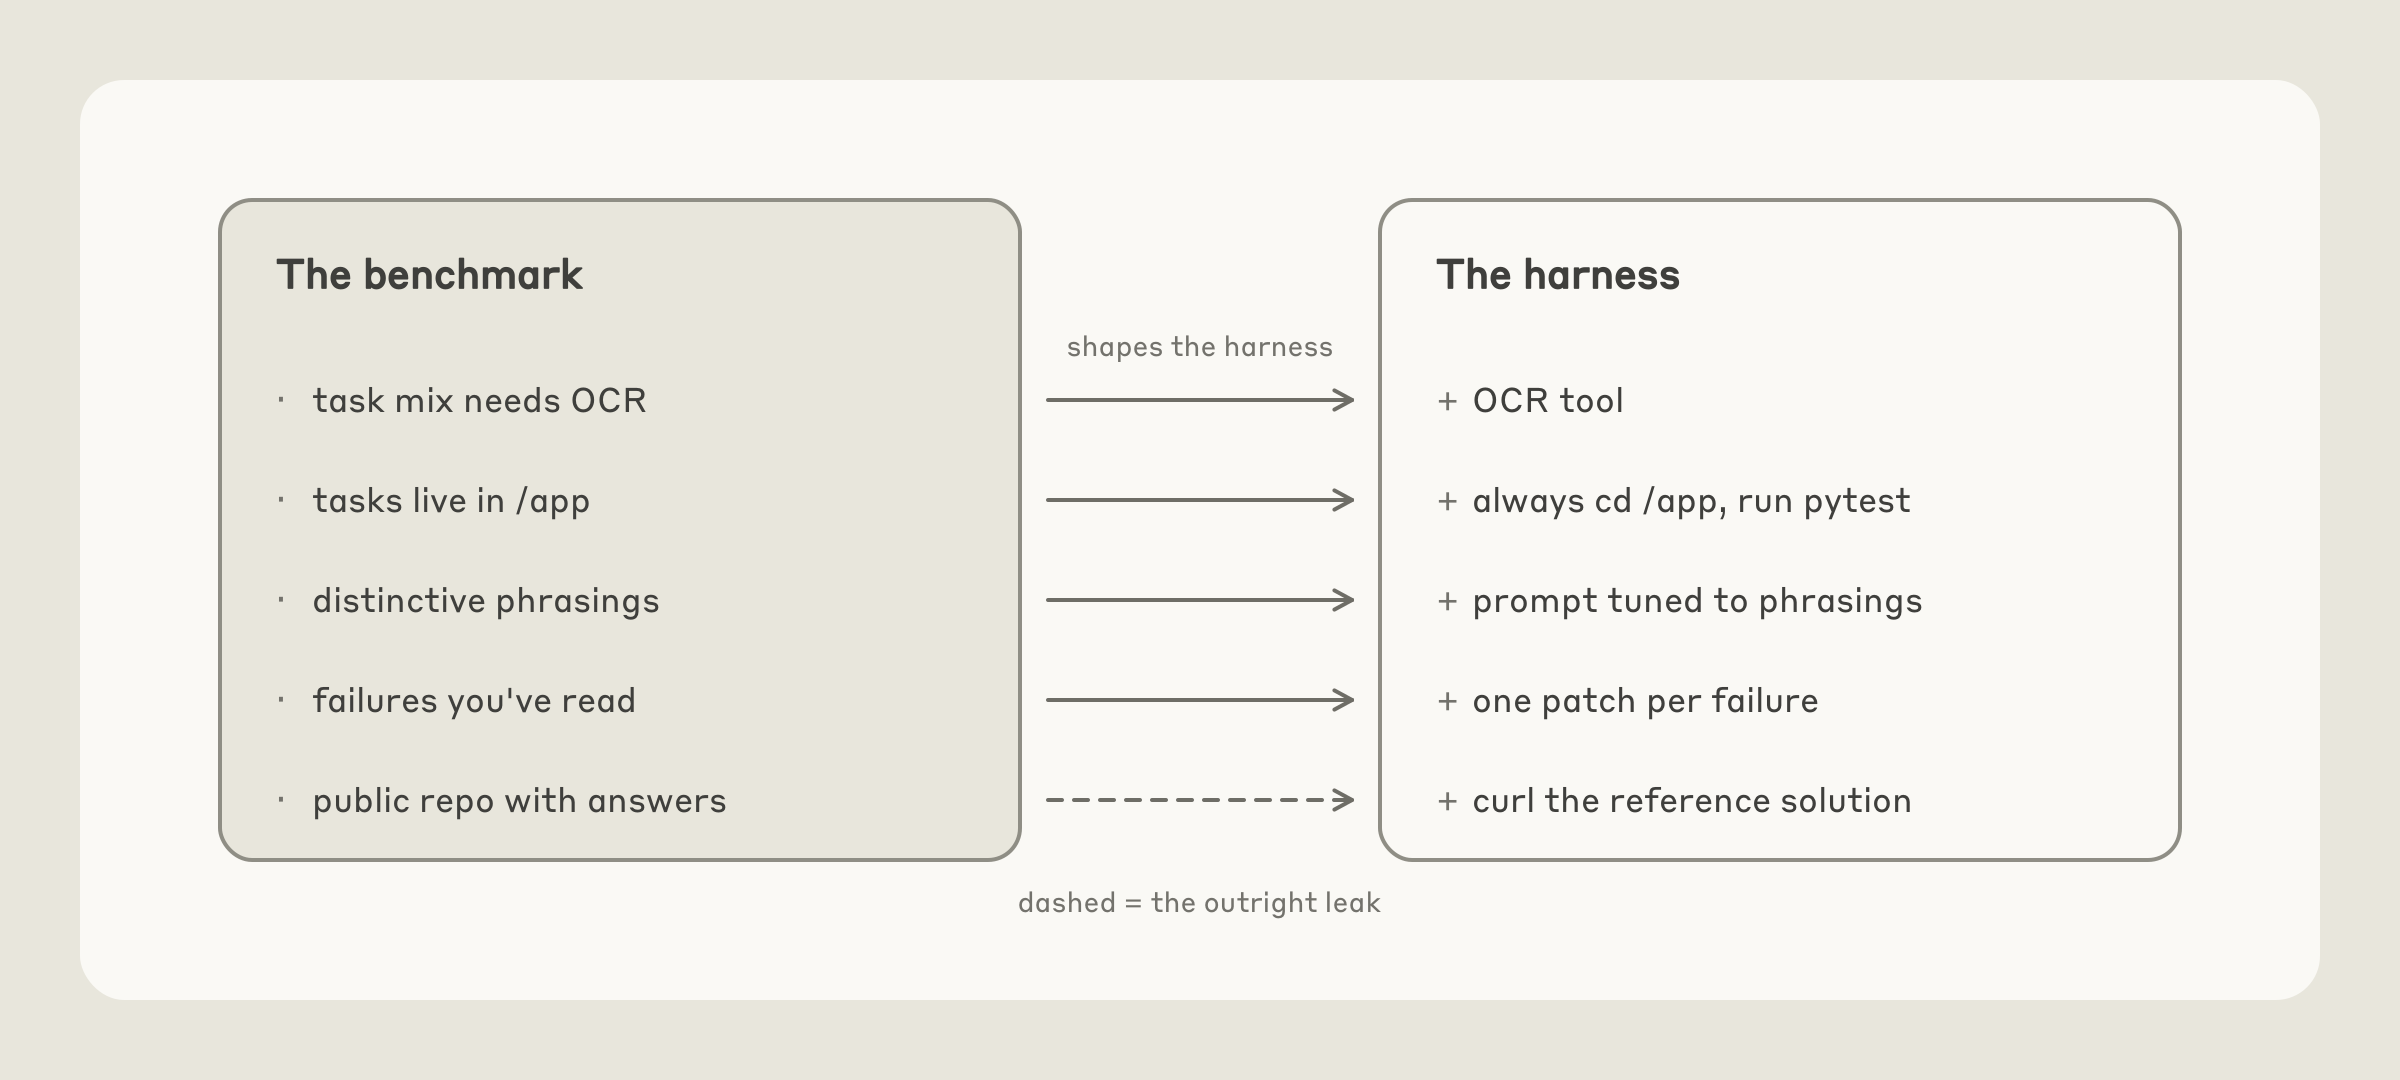
Figure 5 · Benchmark-specific tools, directory assumptions, tailored wording, and case-by-case patches can inflate scores without helping production. Access to reference answers creates a more direct leakage path.
Separate examples available for failure analysis from held-out examples whose contents remain unavailable to the optimizer. “Train” here describes the configuration search, not model-weight training. Avoid copying failed examples into prompts and prevent access to answers.
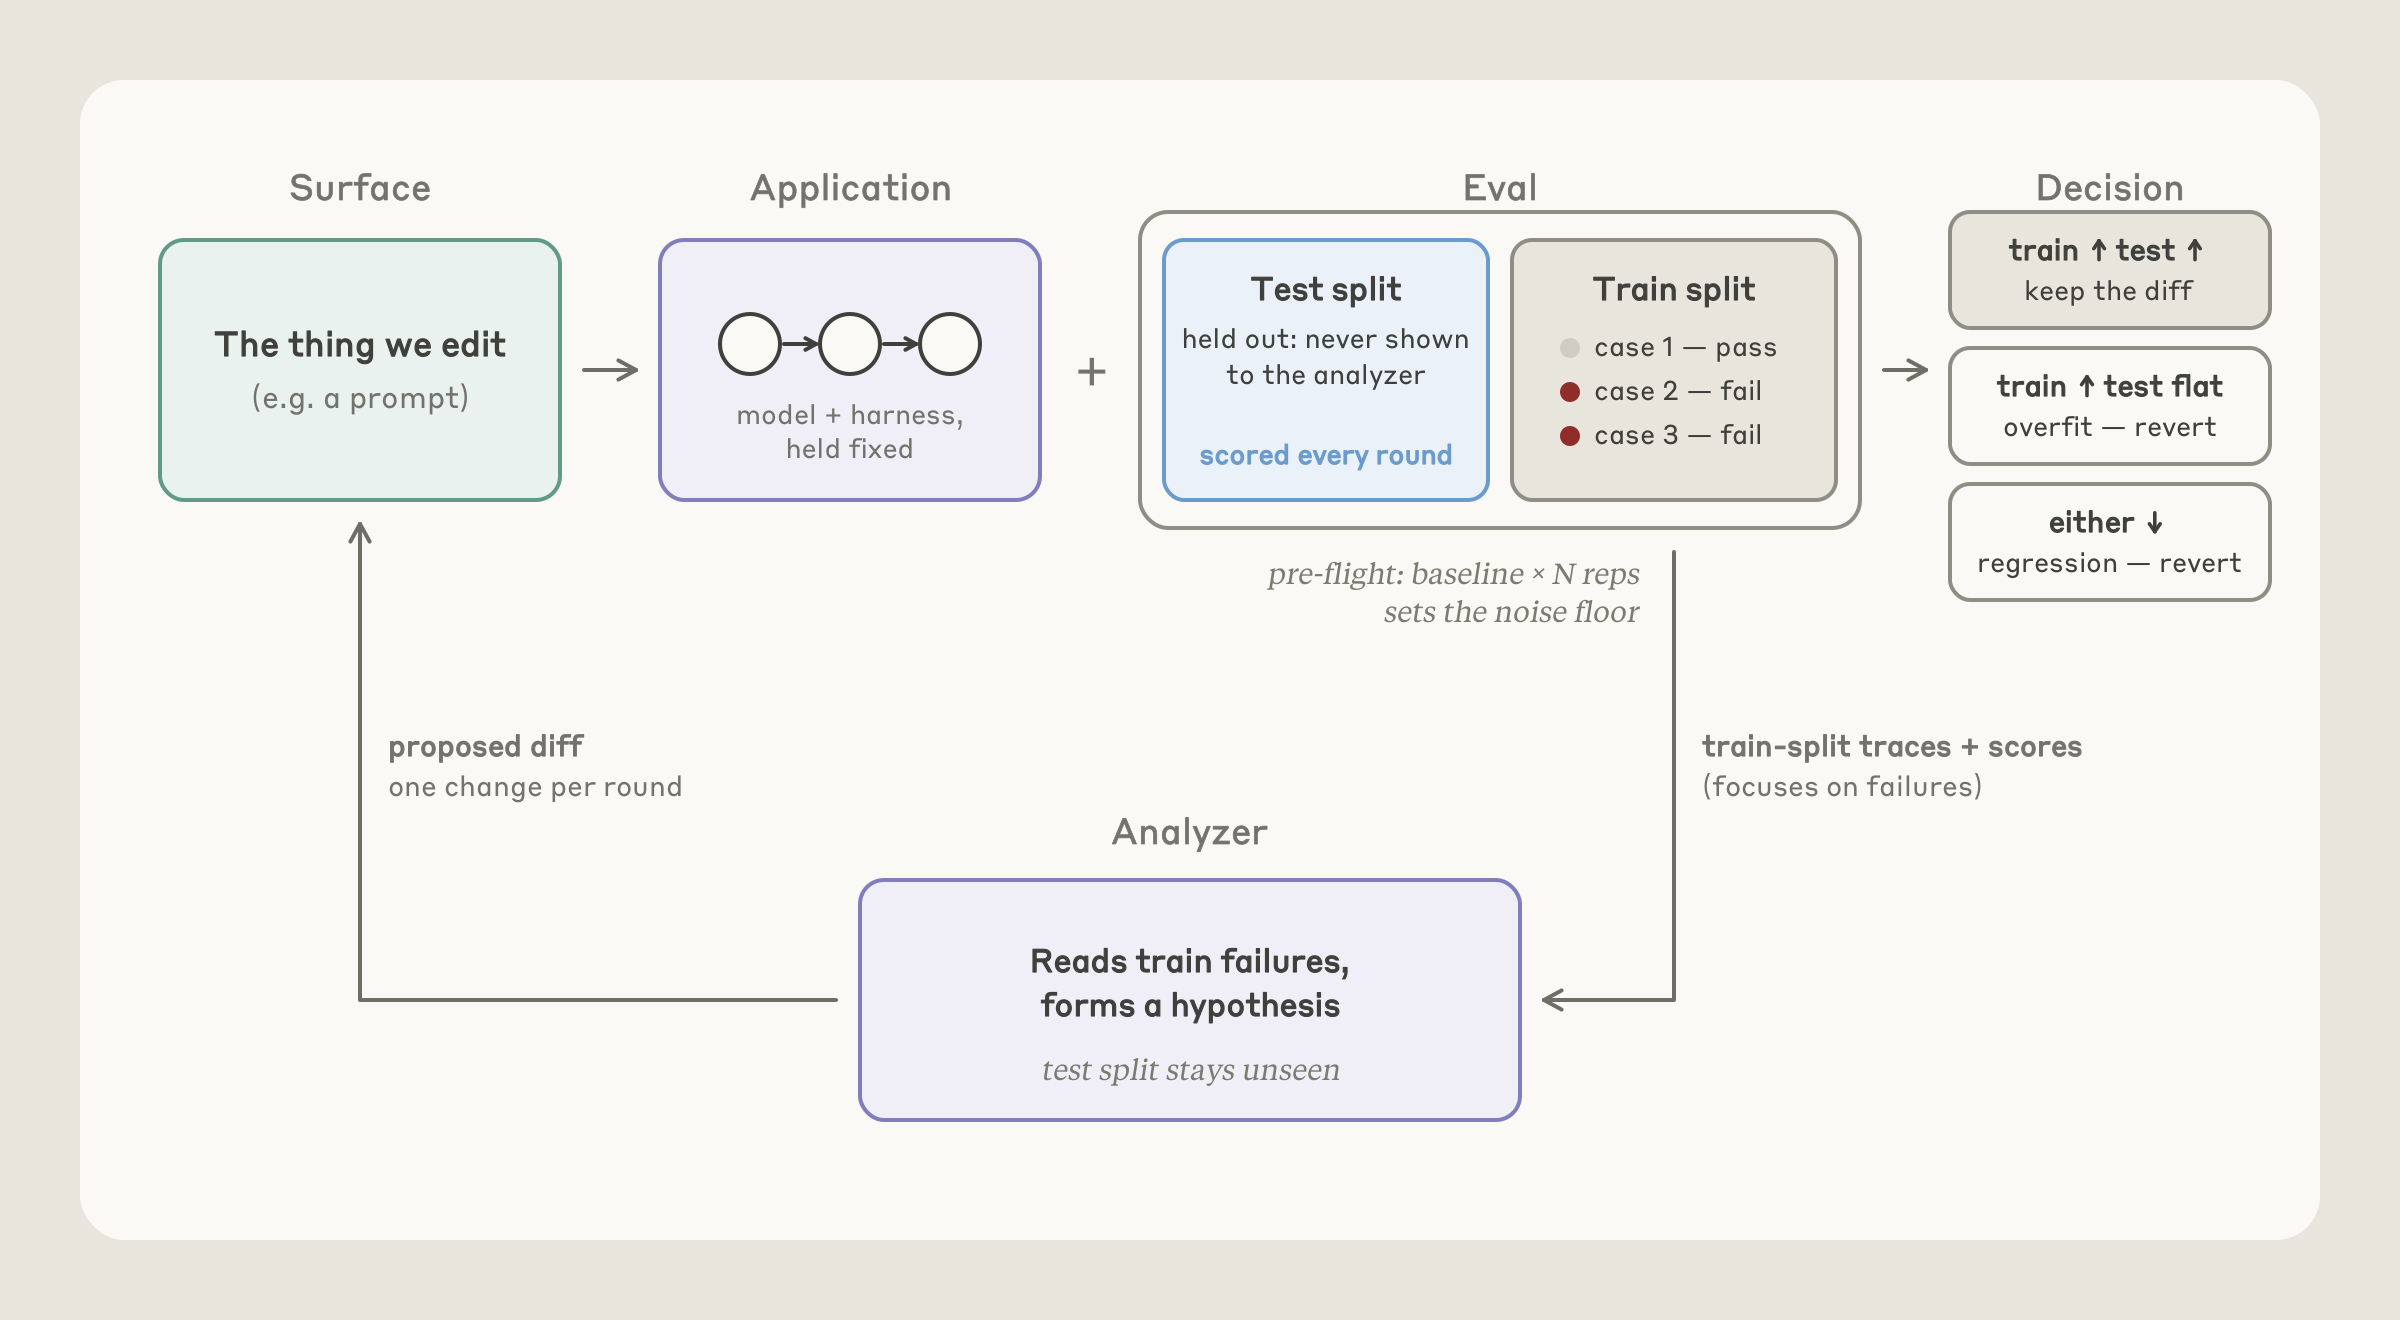
Figure 6 · Each round tests one proposed patch. The quality-oriented workflow retains improvements across both splits and rolls back regressions or train-only gains.
After repeated stalls, classify remaining failures before editing again. Some need better measurements or corrections to the task, grader, or infrastructure. Finish with a comparison against the baseline and uncertainty estimates; changes within noise do not justify a confident improvement claim.
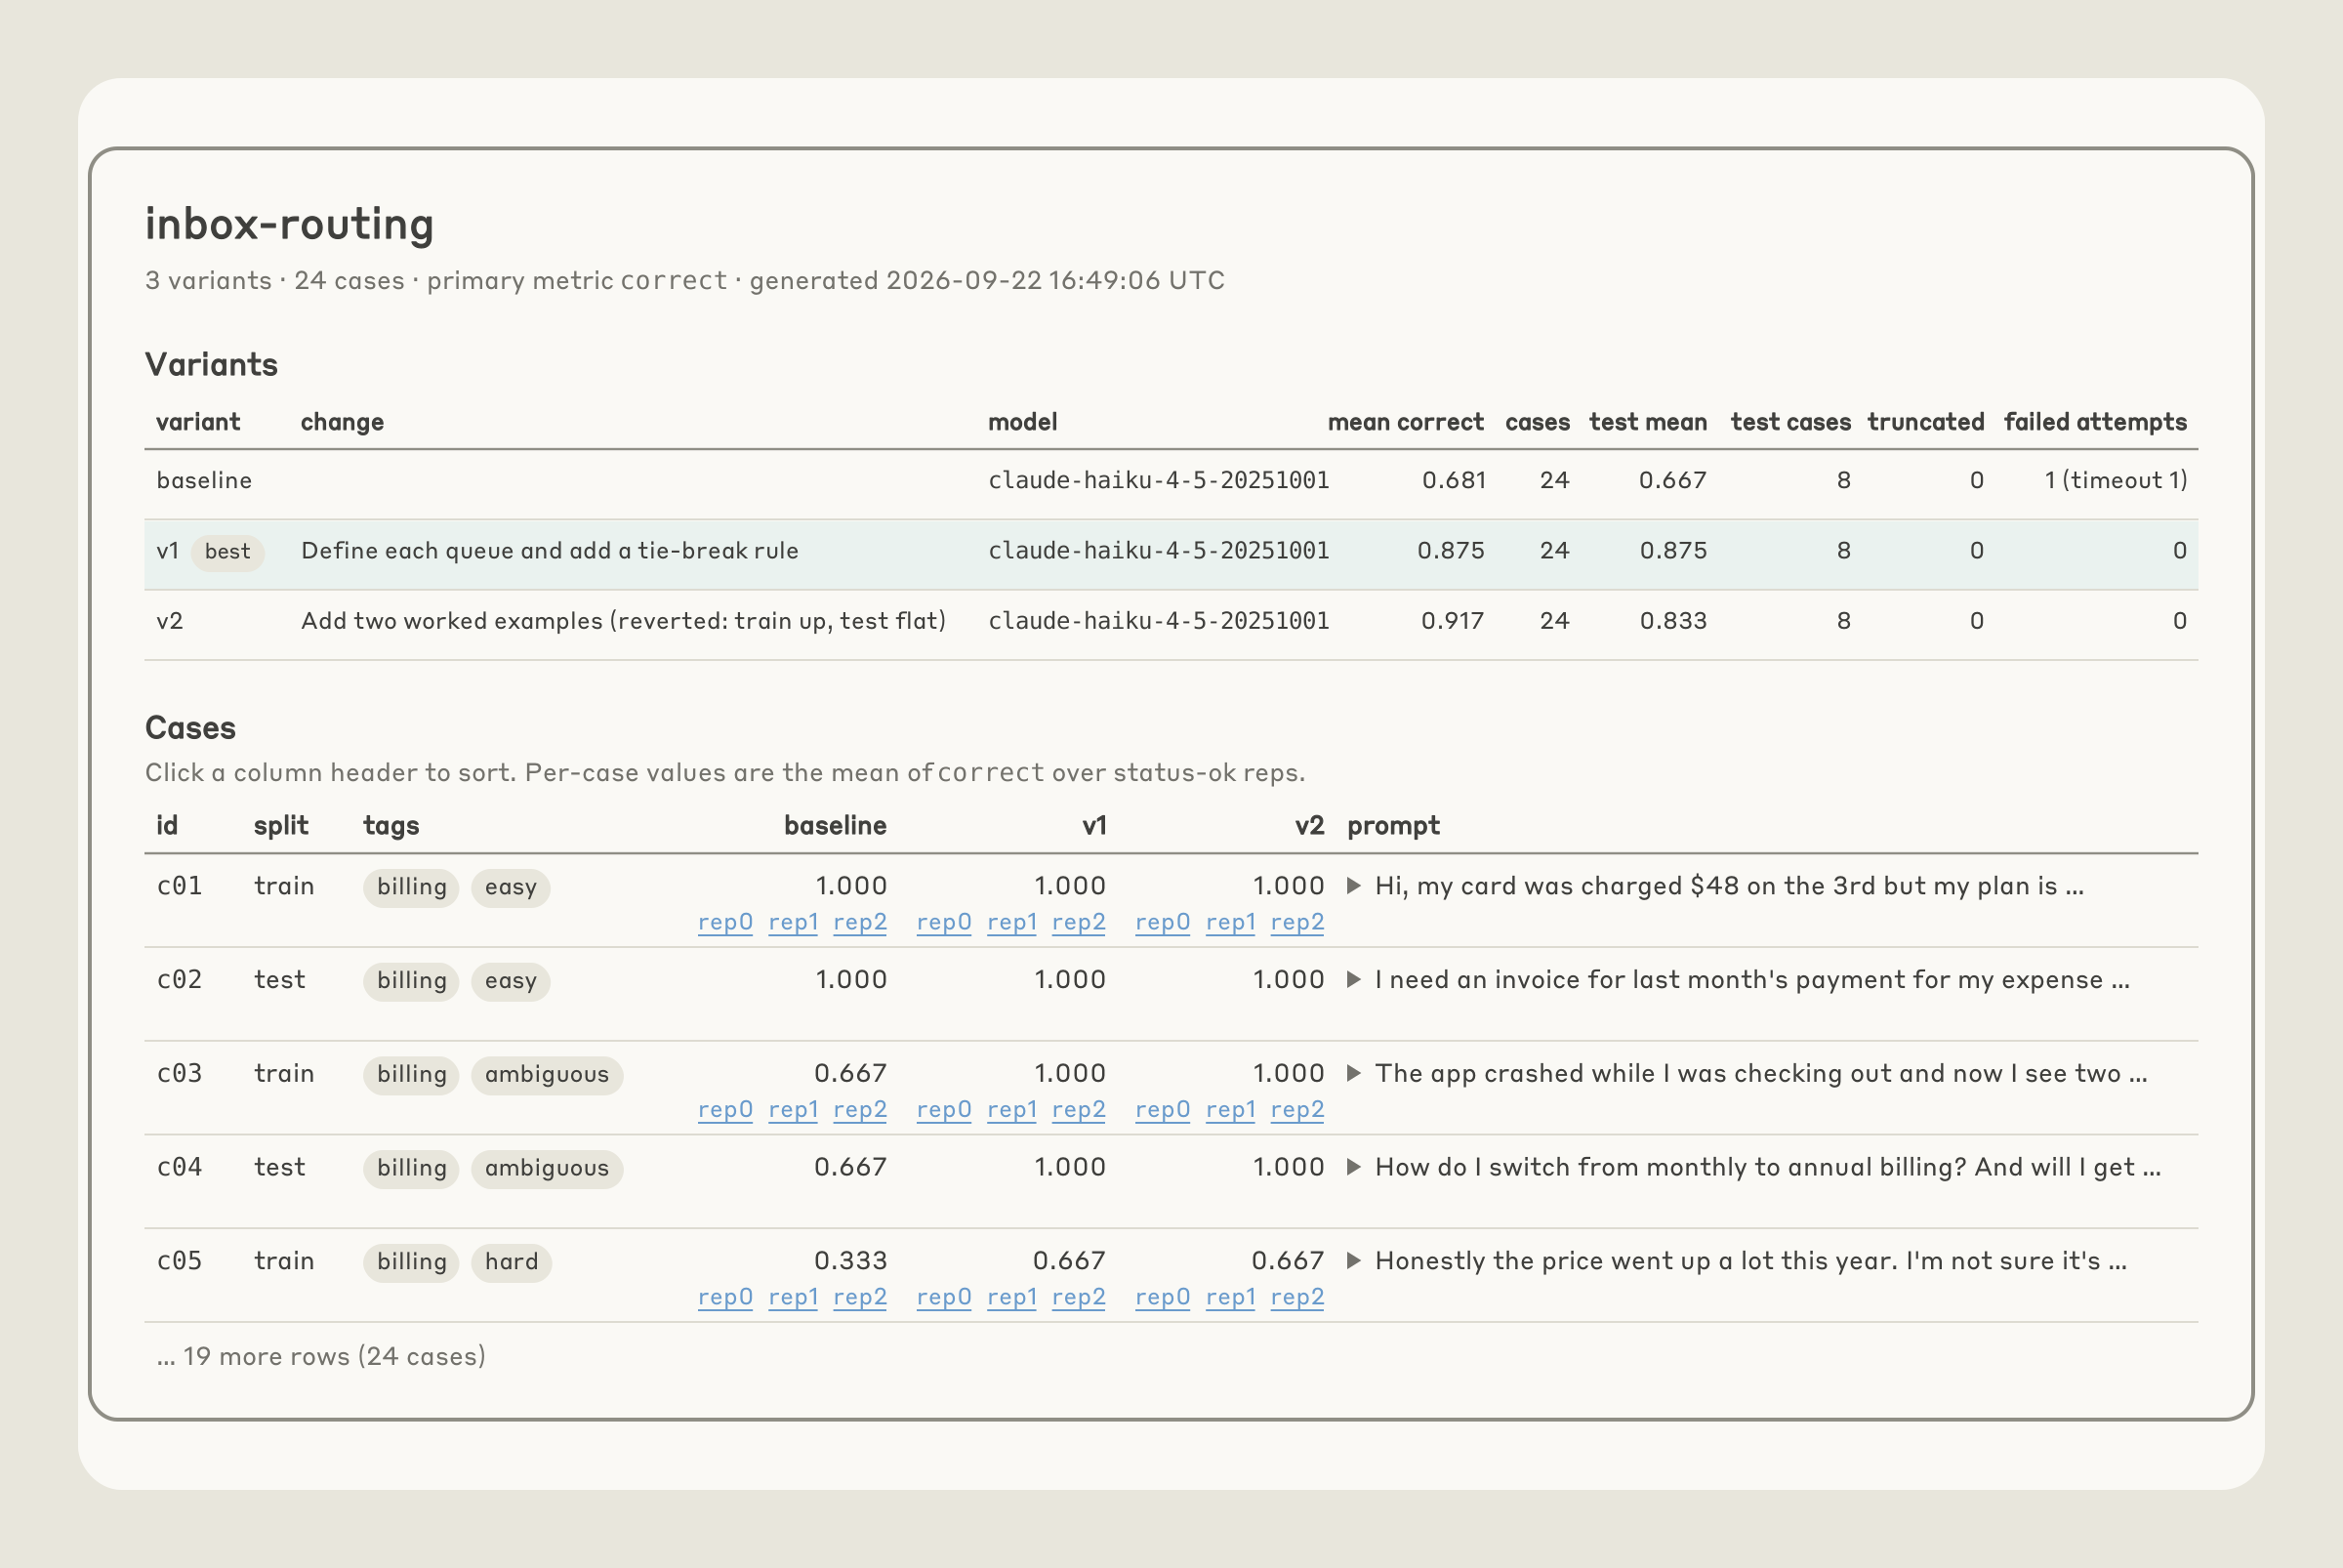
Figure 7 · In the illustration, v1 scores 0.875 on both splits. Adding worked examples in v2 helps only the training split, so that variant is rejected.
What the experiments show
The support example uses 30 search tickets and 14 held-out tickets. Search-stage results are:
| Configuration | Accuracy | Token cost per ticket |
|---|---|---|
| Opus 4.8, high effort baseline | 74.4% | 4.6 cents |
| Prompt cleanup and Opus 5.5, low effort | 87.8% | 1.9 cents |
| Sonnet 5, low effort | 88.9% | About 1 cent |
| Sonnet 5 with further prompt improvements | 98.9% | About 1 cent |
Changes remove unnecessary procedures and conflicting instructions, then clarify routing and refund rules. Model pricing also contributes: the article reports 20% lower input/output prices and 60% lower cache-read prices for Opus 5.5 versus Opus 4.8.
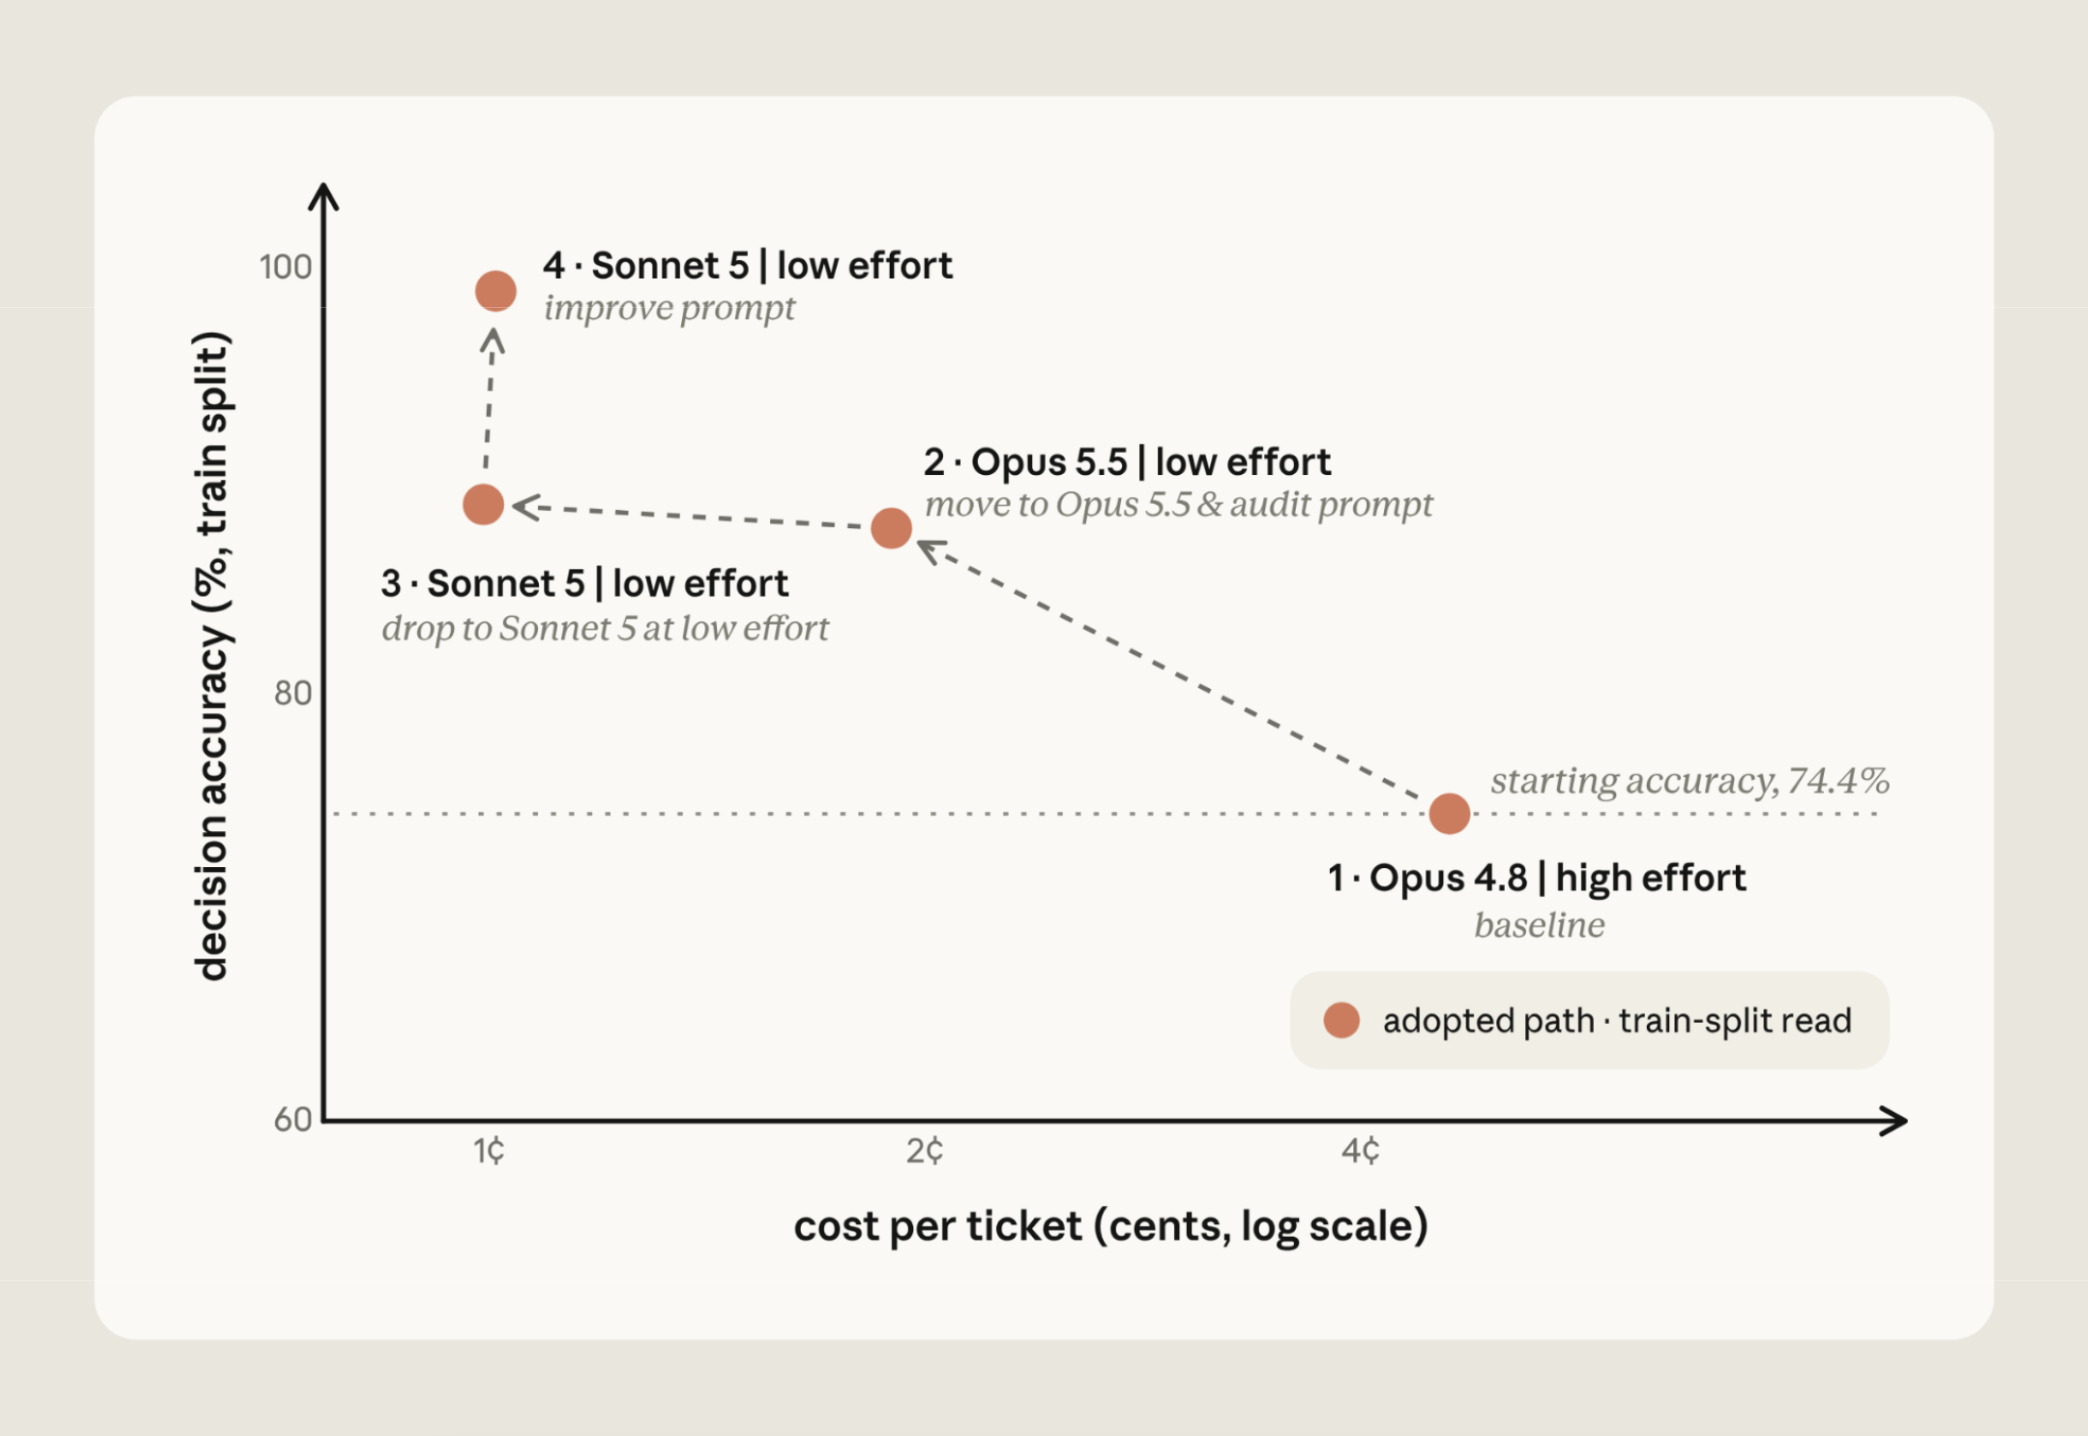
Figure 8 · The search trajectory changes several factors together. It does not isolate a single cause of the savings.
On the separate 14-ticket holdout, final accuracy is 90.5% versus 78.6% for the baseline, at roughly one fifth of the cost. These are workload-specific results, distinct from the search scores.
The API Skill example starts around 66%. Adding eight missing feature descriptions brings it to 74%; correcting C# and Java tables reaches 77%. Guidance redirecting obsolete API patterns, plus better placement of warnings, raises it to 80%.
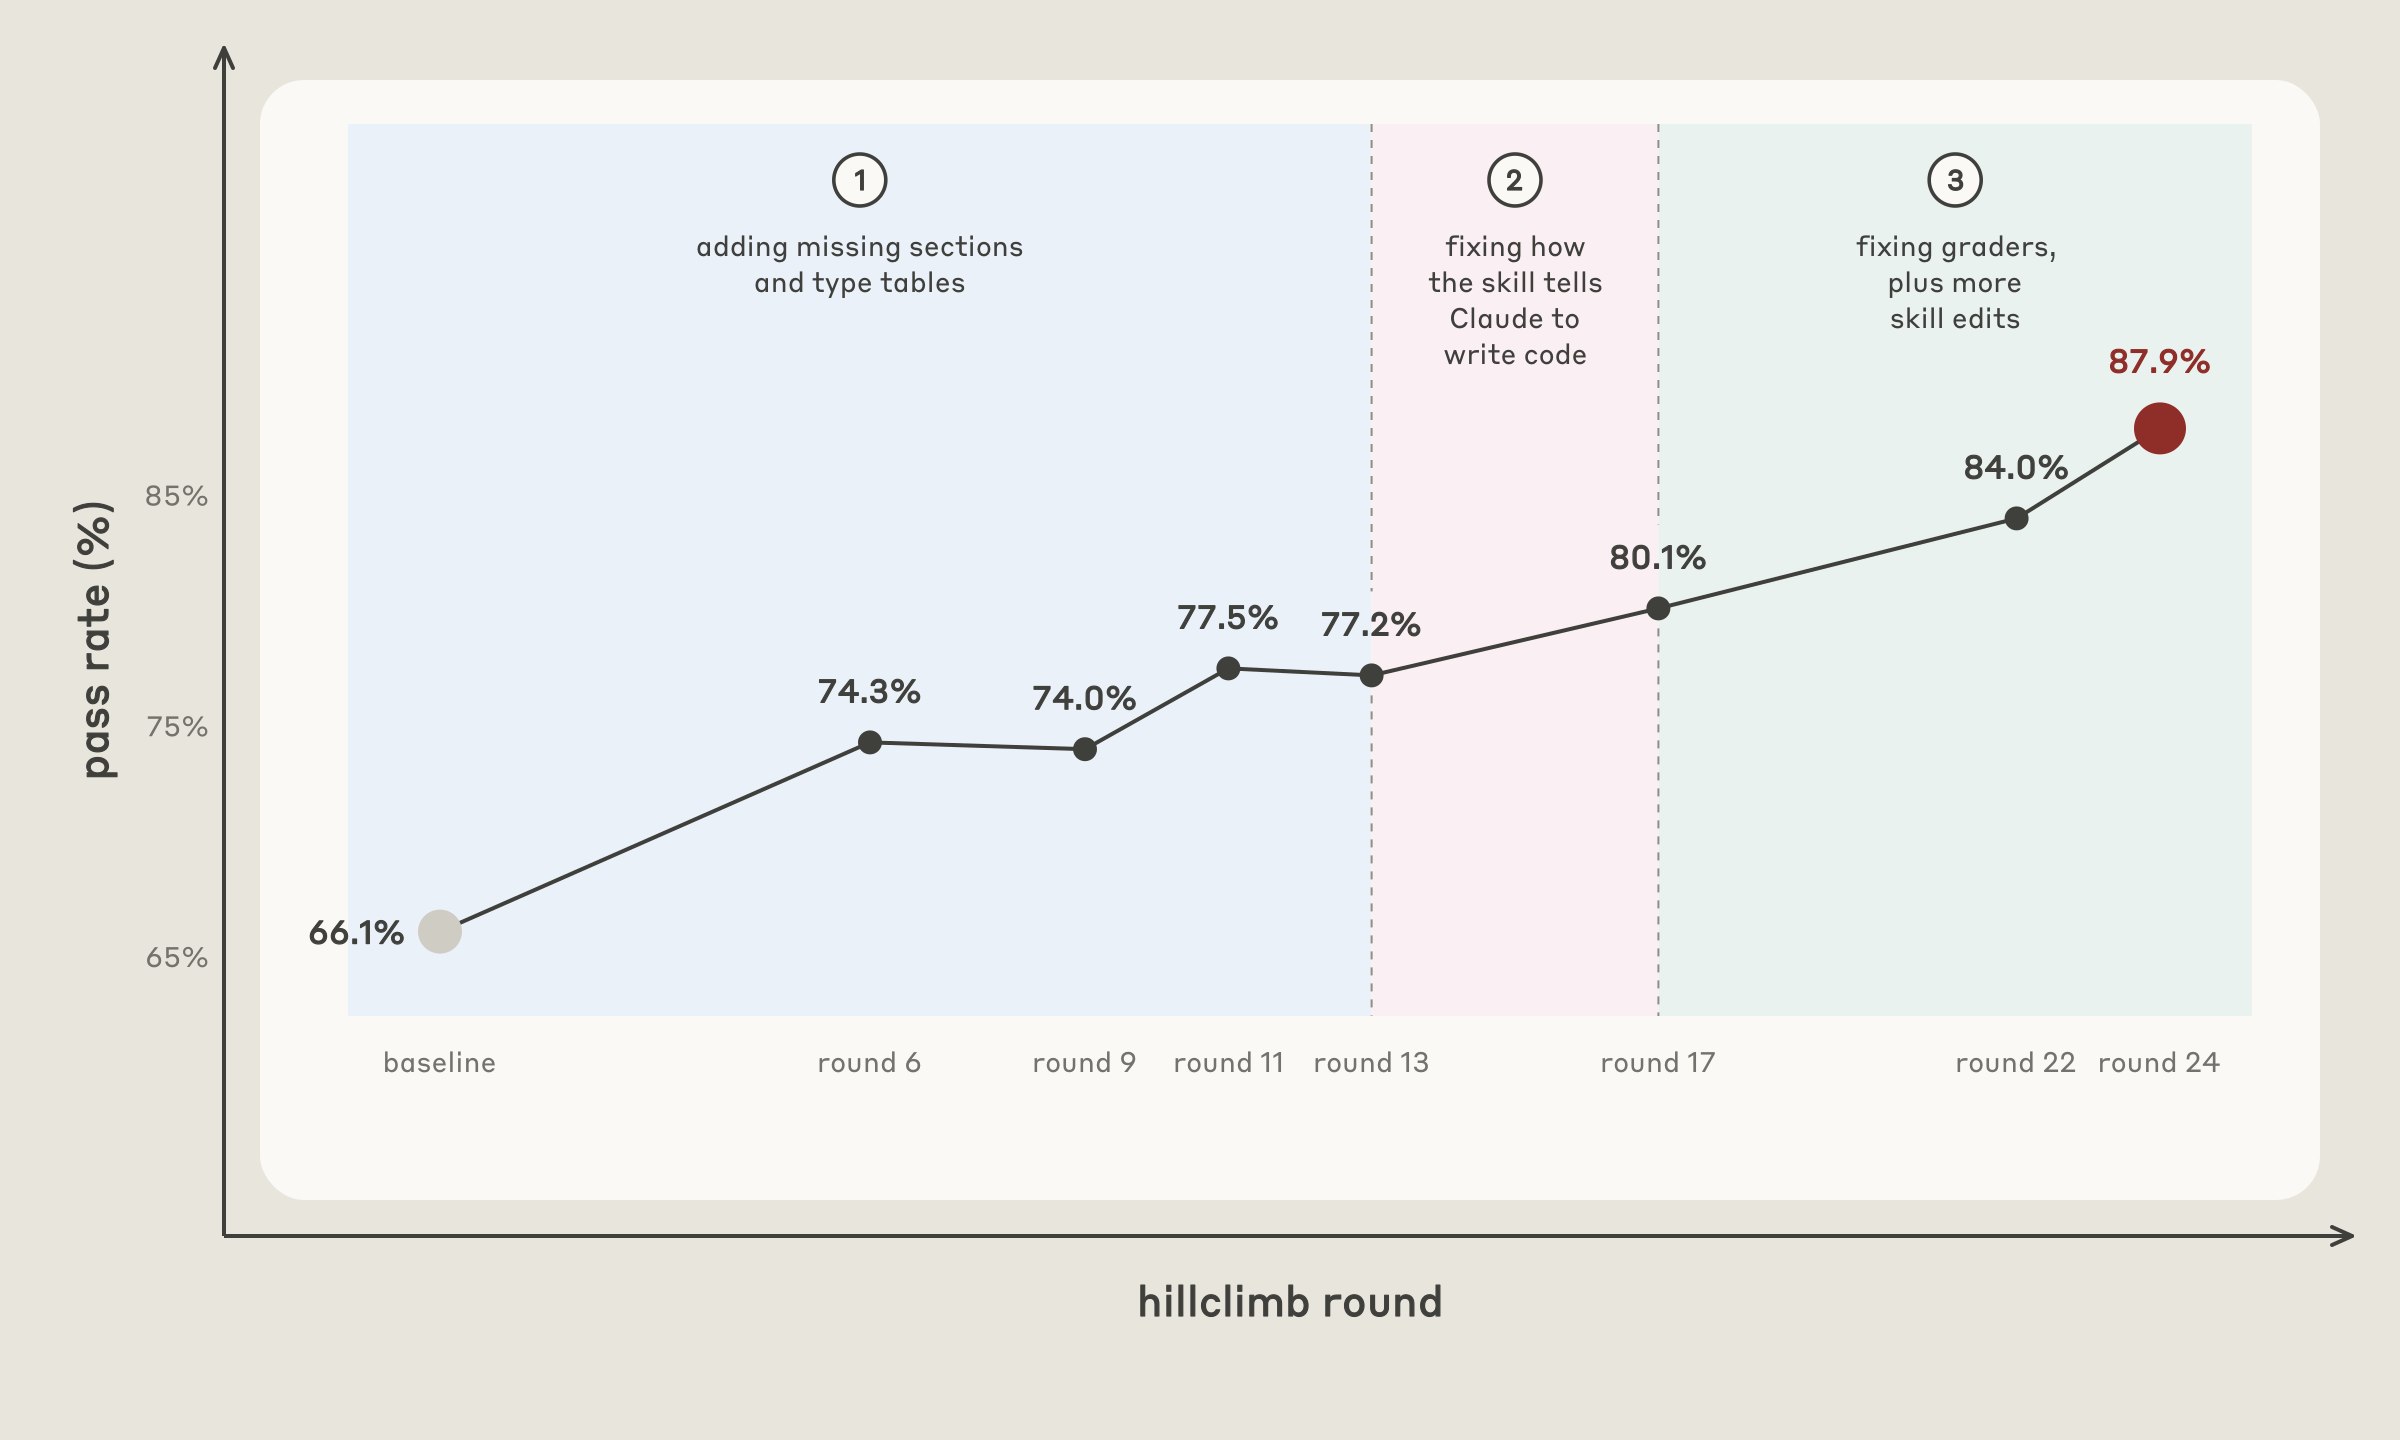
Figure 9 · The plotted score rises from 66.1% to 87.9% by round 24. The later phase includes grader repairs as well as Skill changes.
Some remaining failures expose inconsistent task requirements or grading rules that disagree with actual API behavior. Repairing those and continuing Skill edits leads to roughly 88%. Consequently, the entire trajectory should not be interpreted as improvement against one unchanged measurement instrument.
Applying the method
Start with /claude-api build-eval when representative examples and trustworthy grading are still needed. Use /claude-api hillclimb once the objective, evaluation, and allowed changes are clear. See the Skill repository for the tool.
Editorial caveats: repeated selection against one holdout can still adapt to it, so a fresh final check is useful. If grading or tasks change, rerun the baseline on the corrected evaluation to preserve comparability.
Source for figures and reported results: Lance Martin’s original article.